State of Application Strategy Report 2023
Lead Illustrator
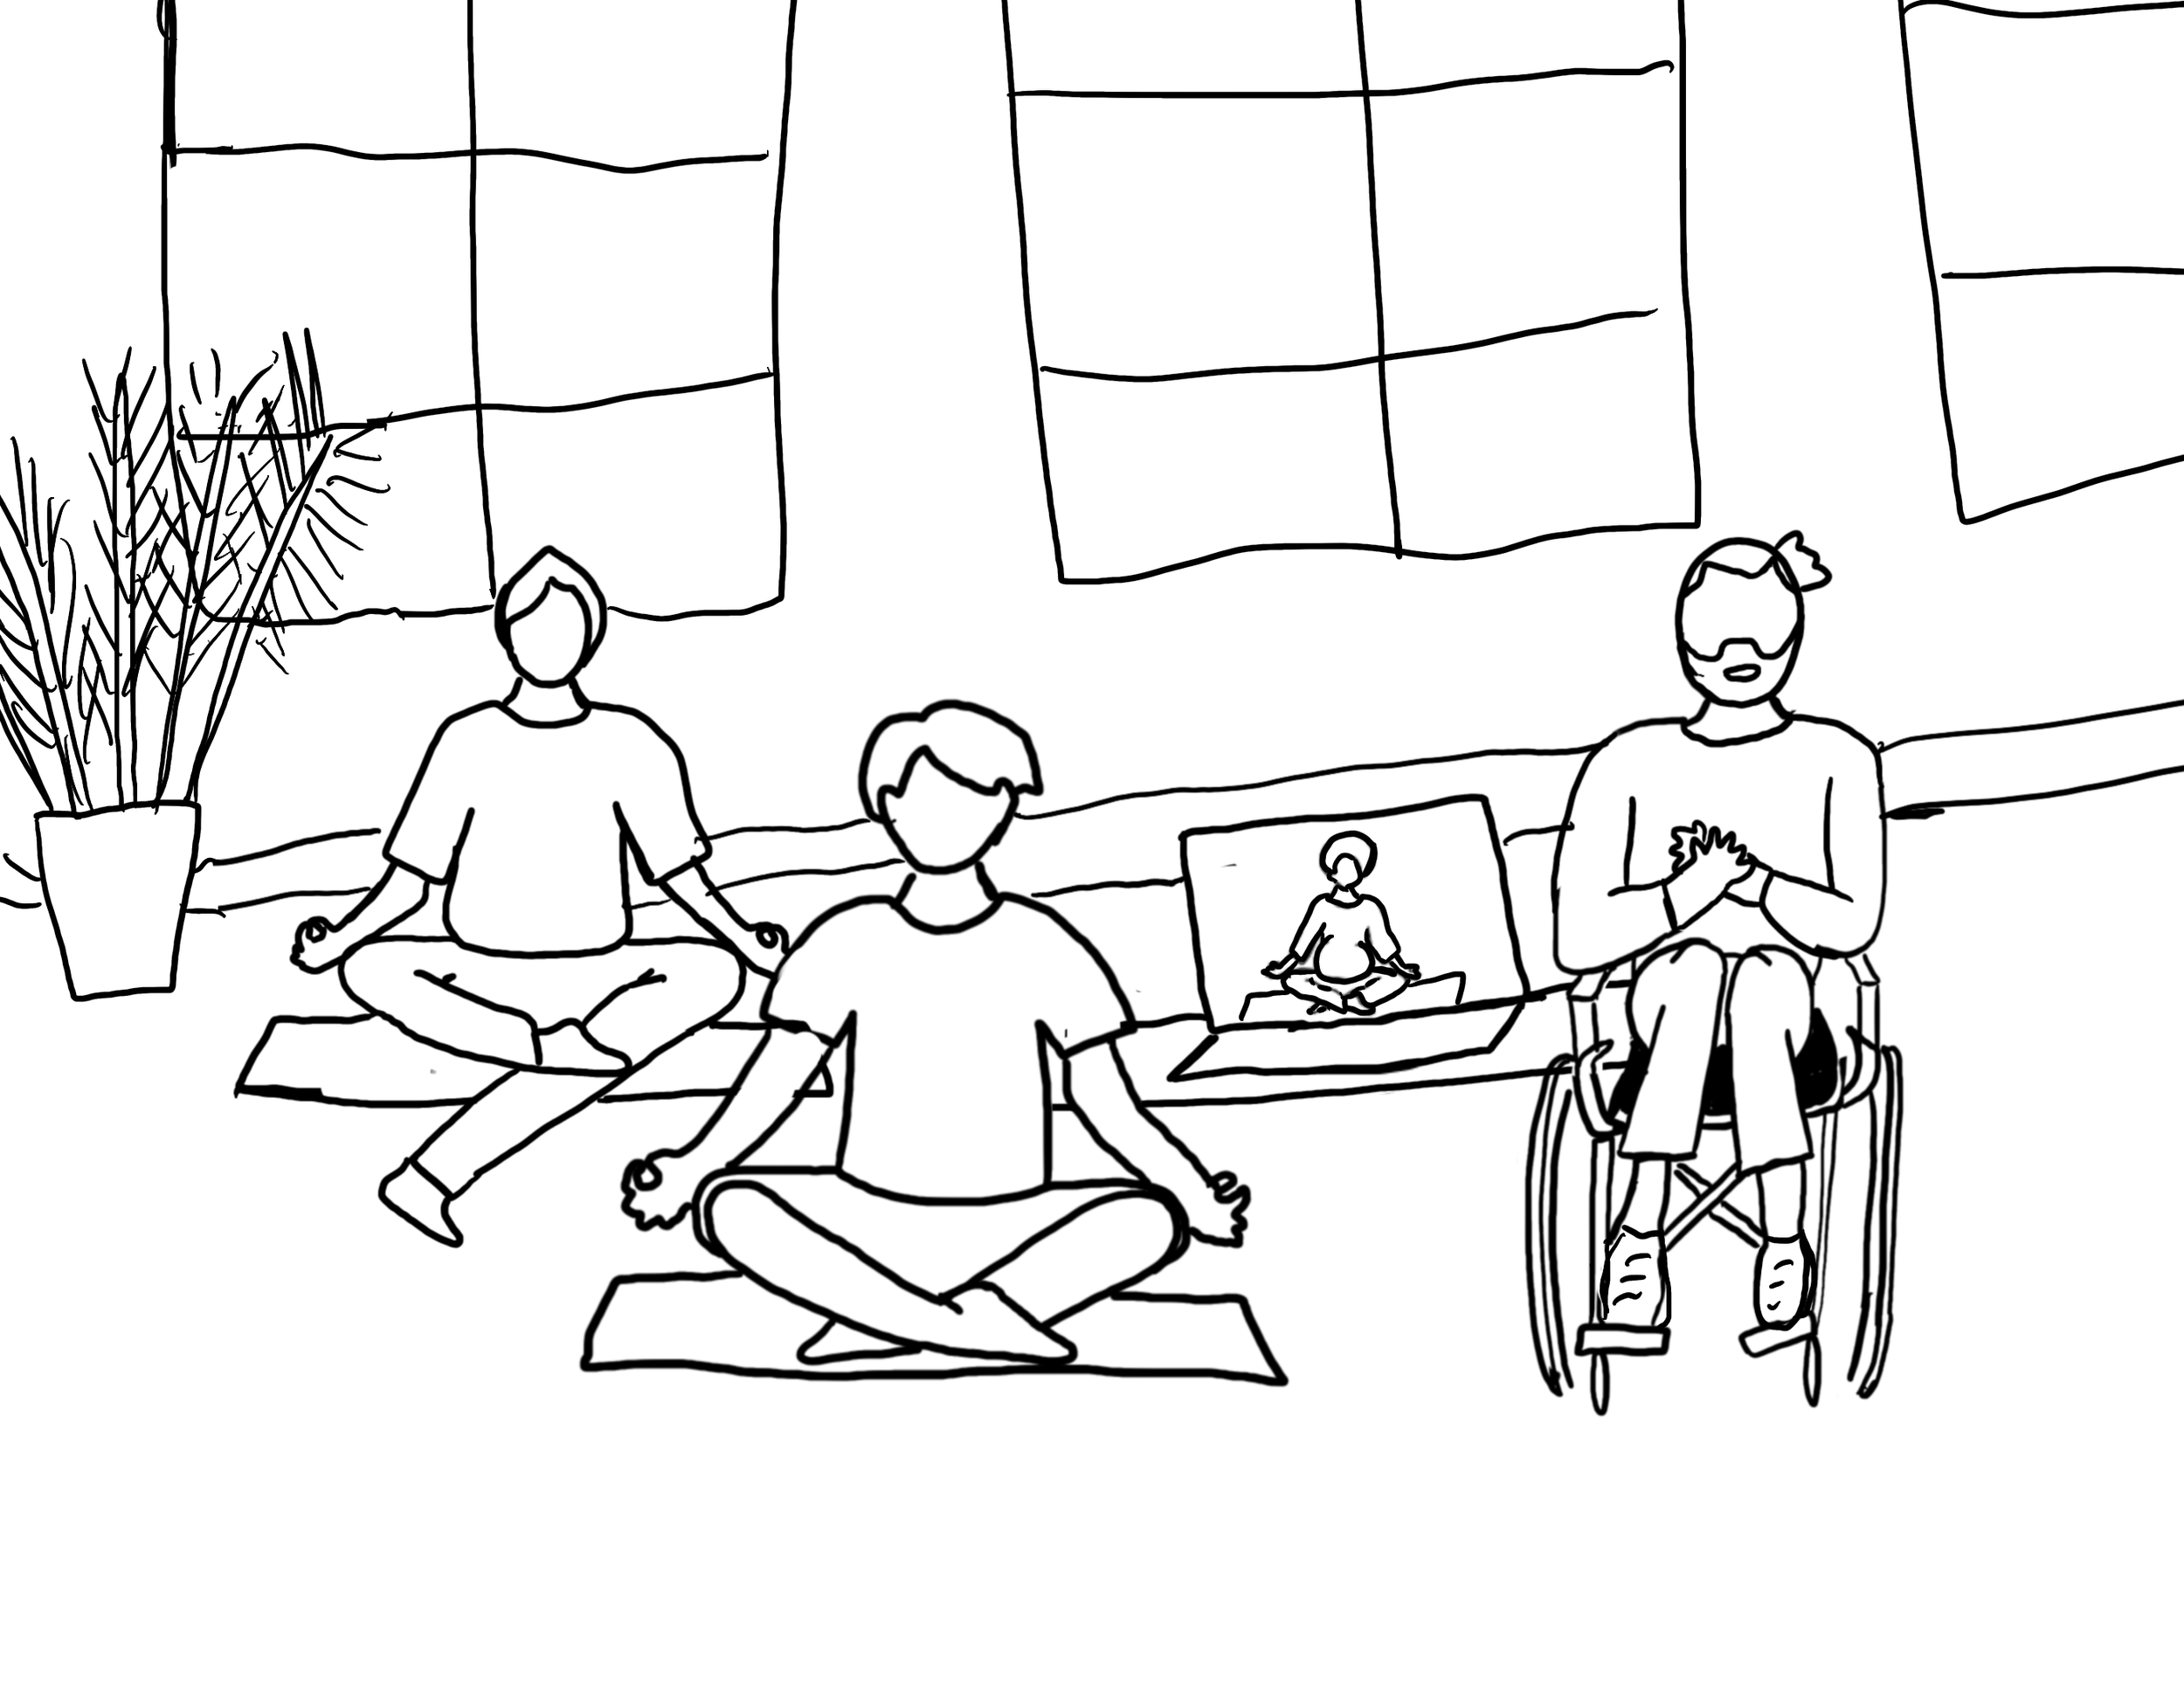
The State of Application Strategy Report (SOAS) is published annually. In this year's edition, we aimed to update the look and feel of the 2022 report while maintaining continuity. We transitioned away from the isometric grid style employed by F5 for the past two years, opting instead for a 2D illustration approach. Moreover, we decided to spotlight one central character for this year's report: the IT user, complemented by supporting characters. Each illustration was meticulously crafted to narrate a distinct story, enriching the overall report experience.
Process
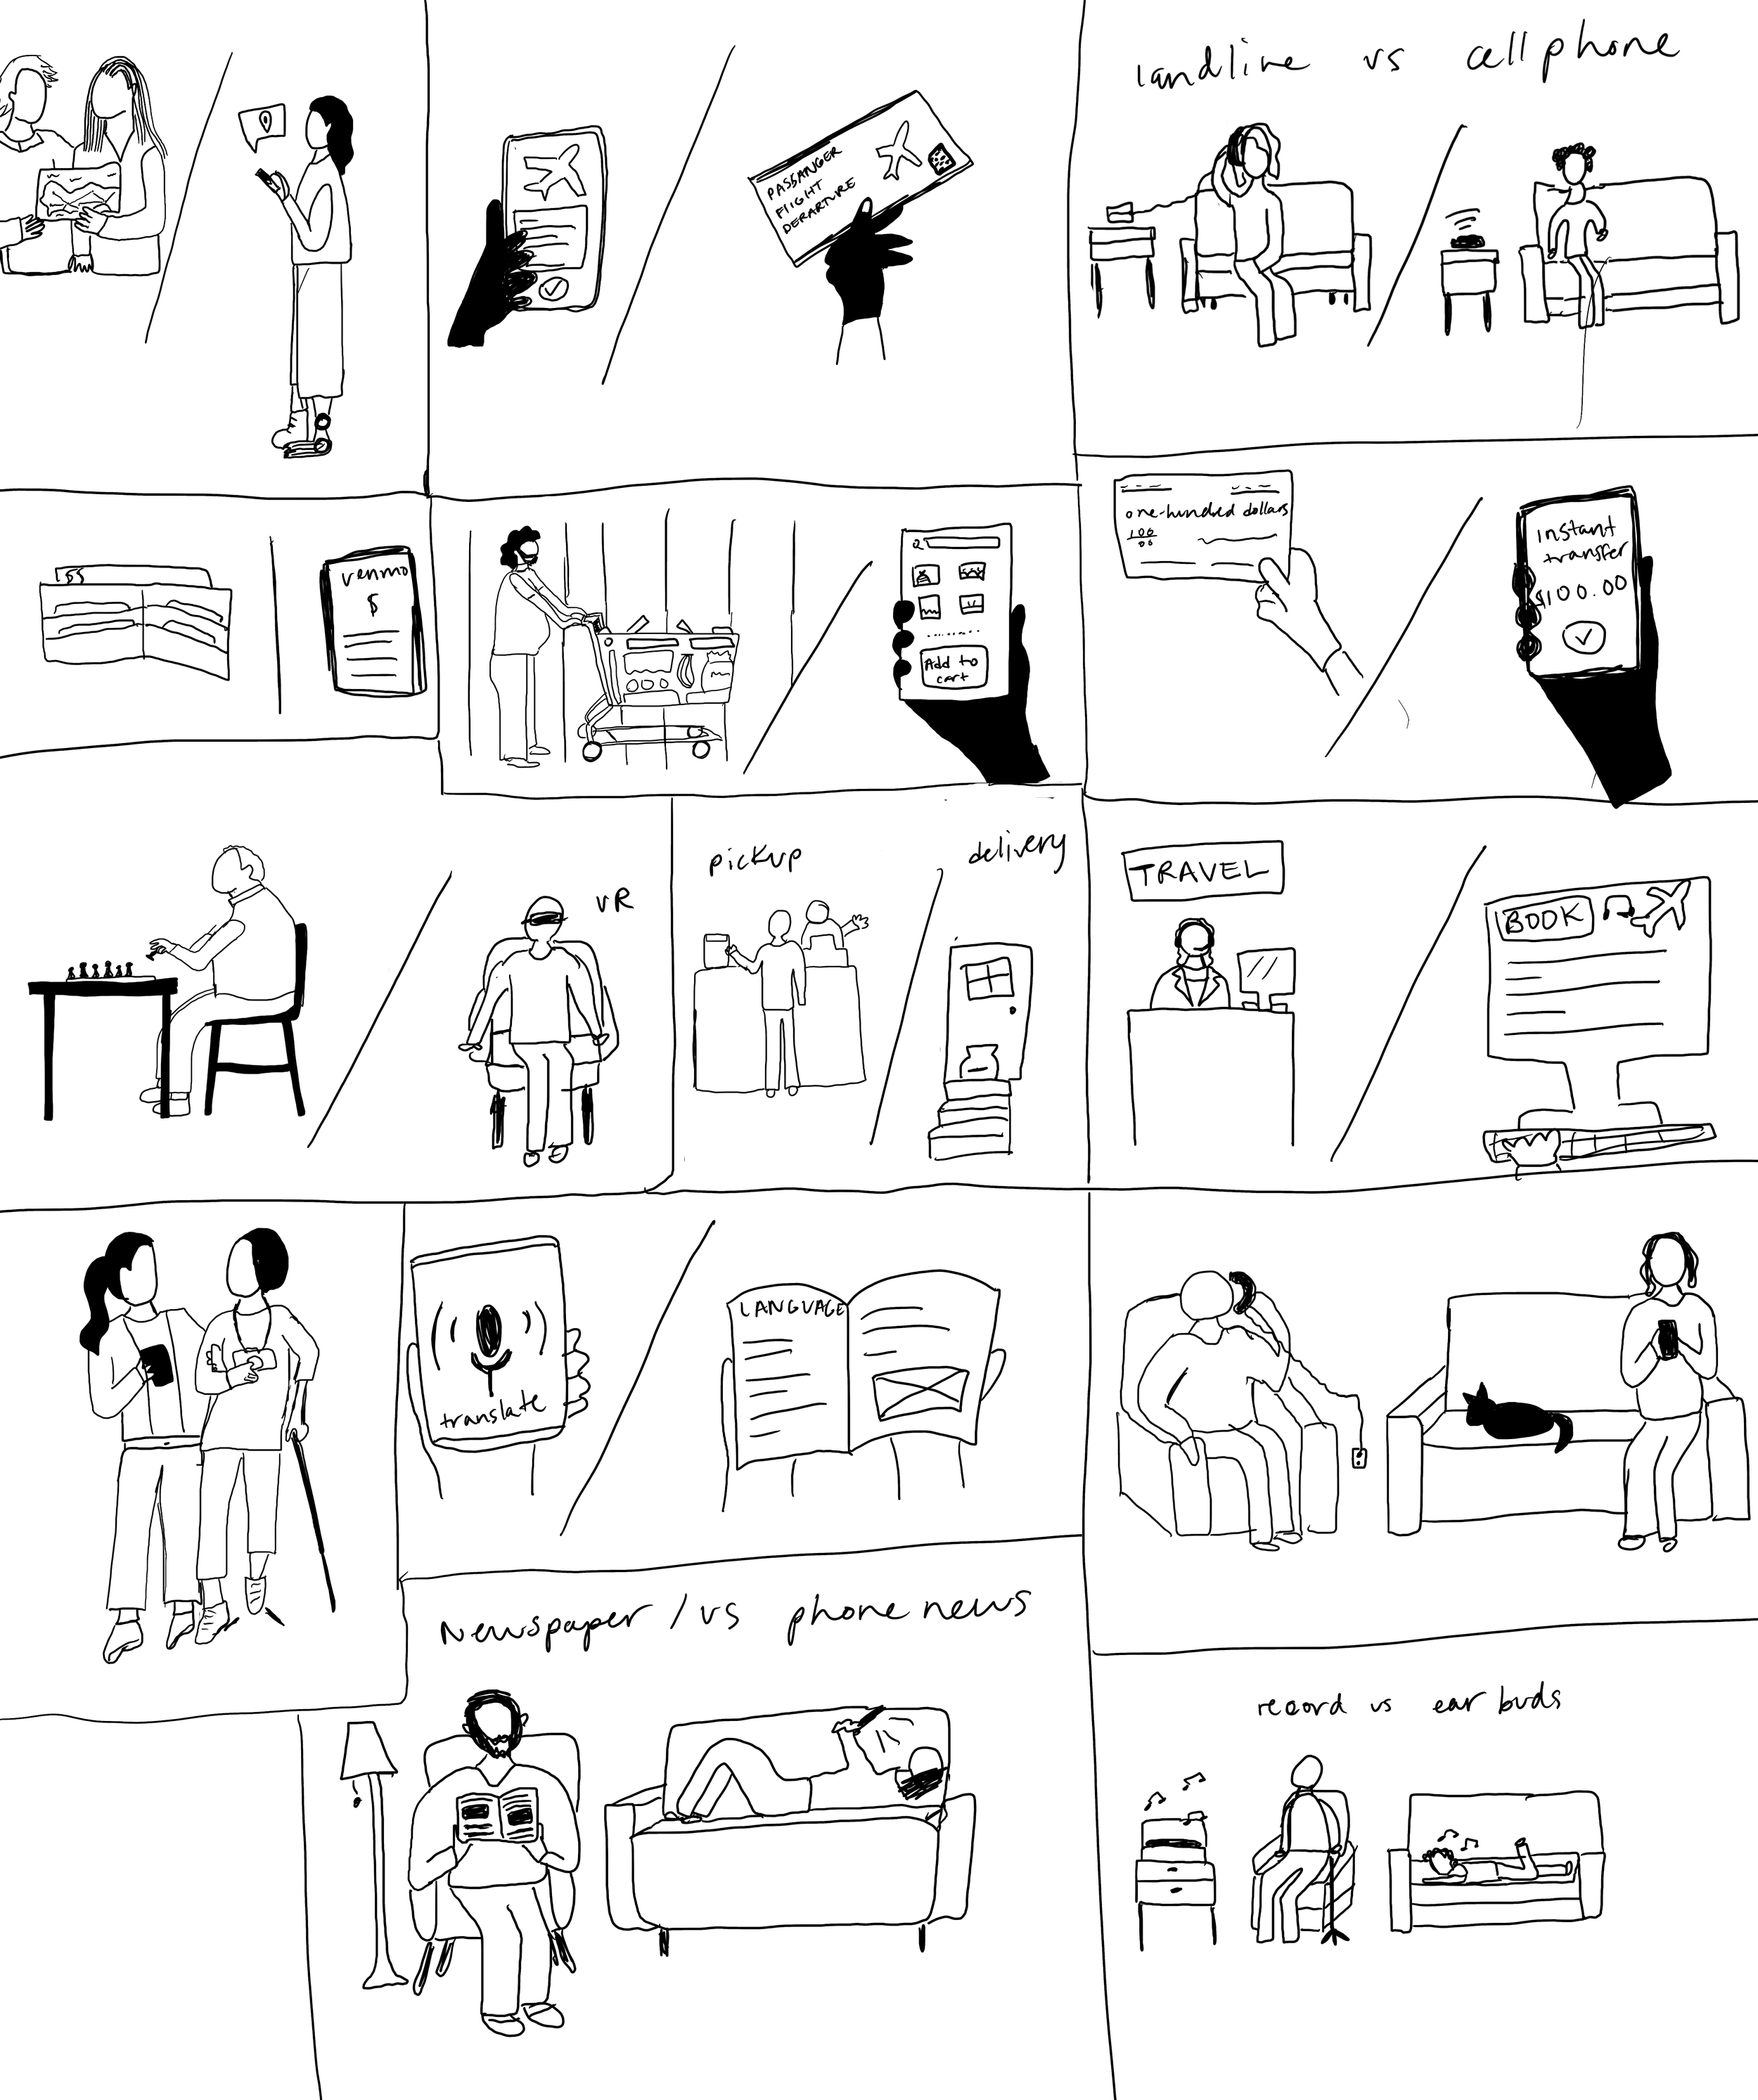
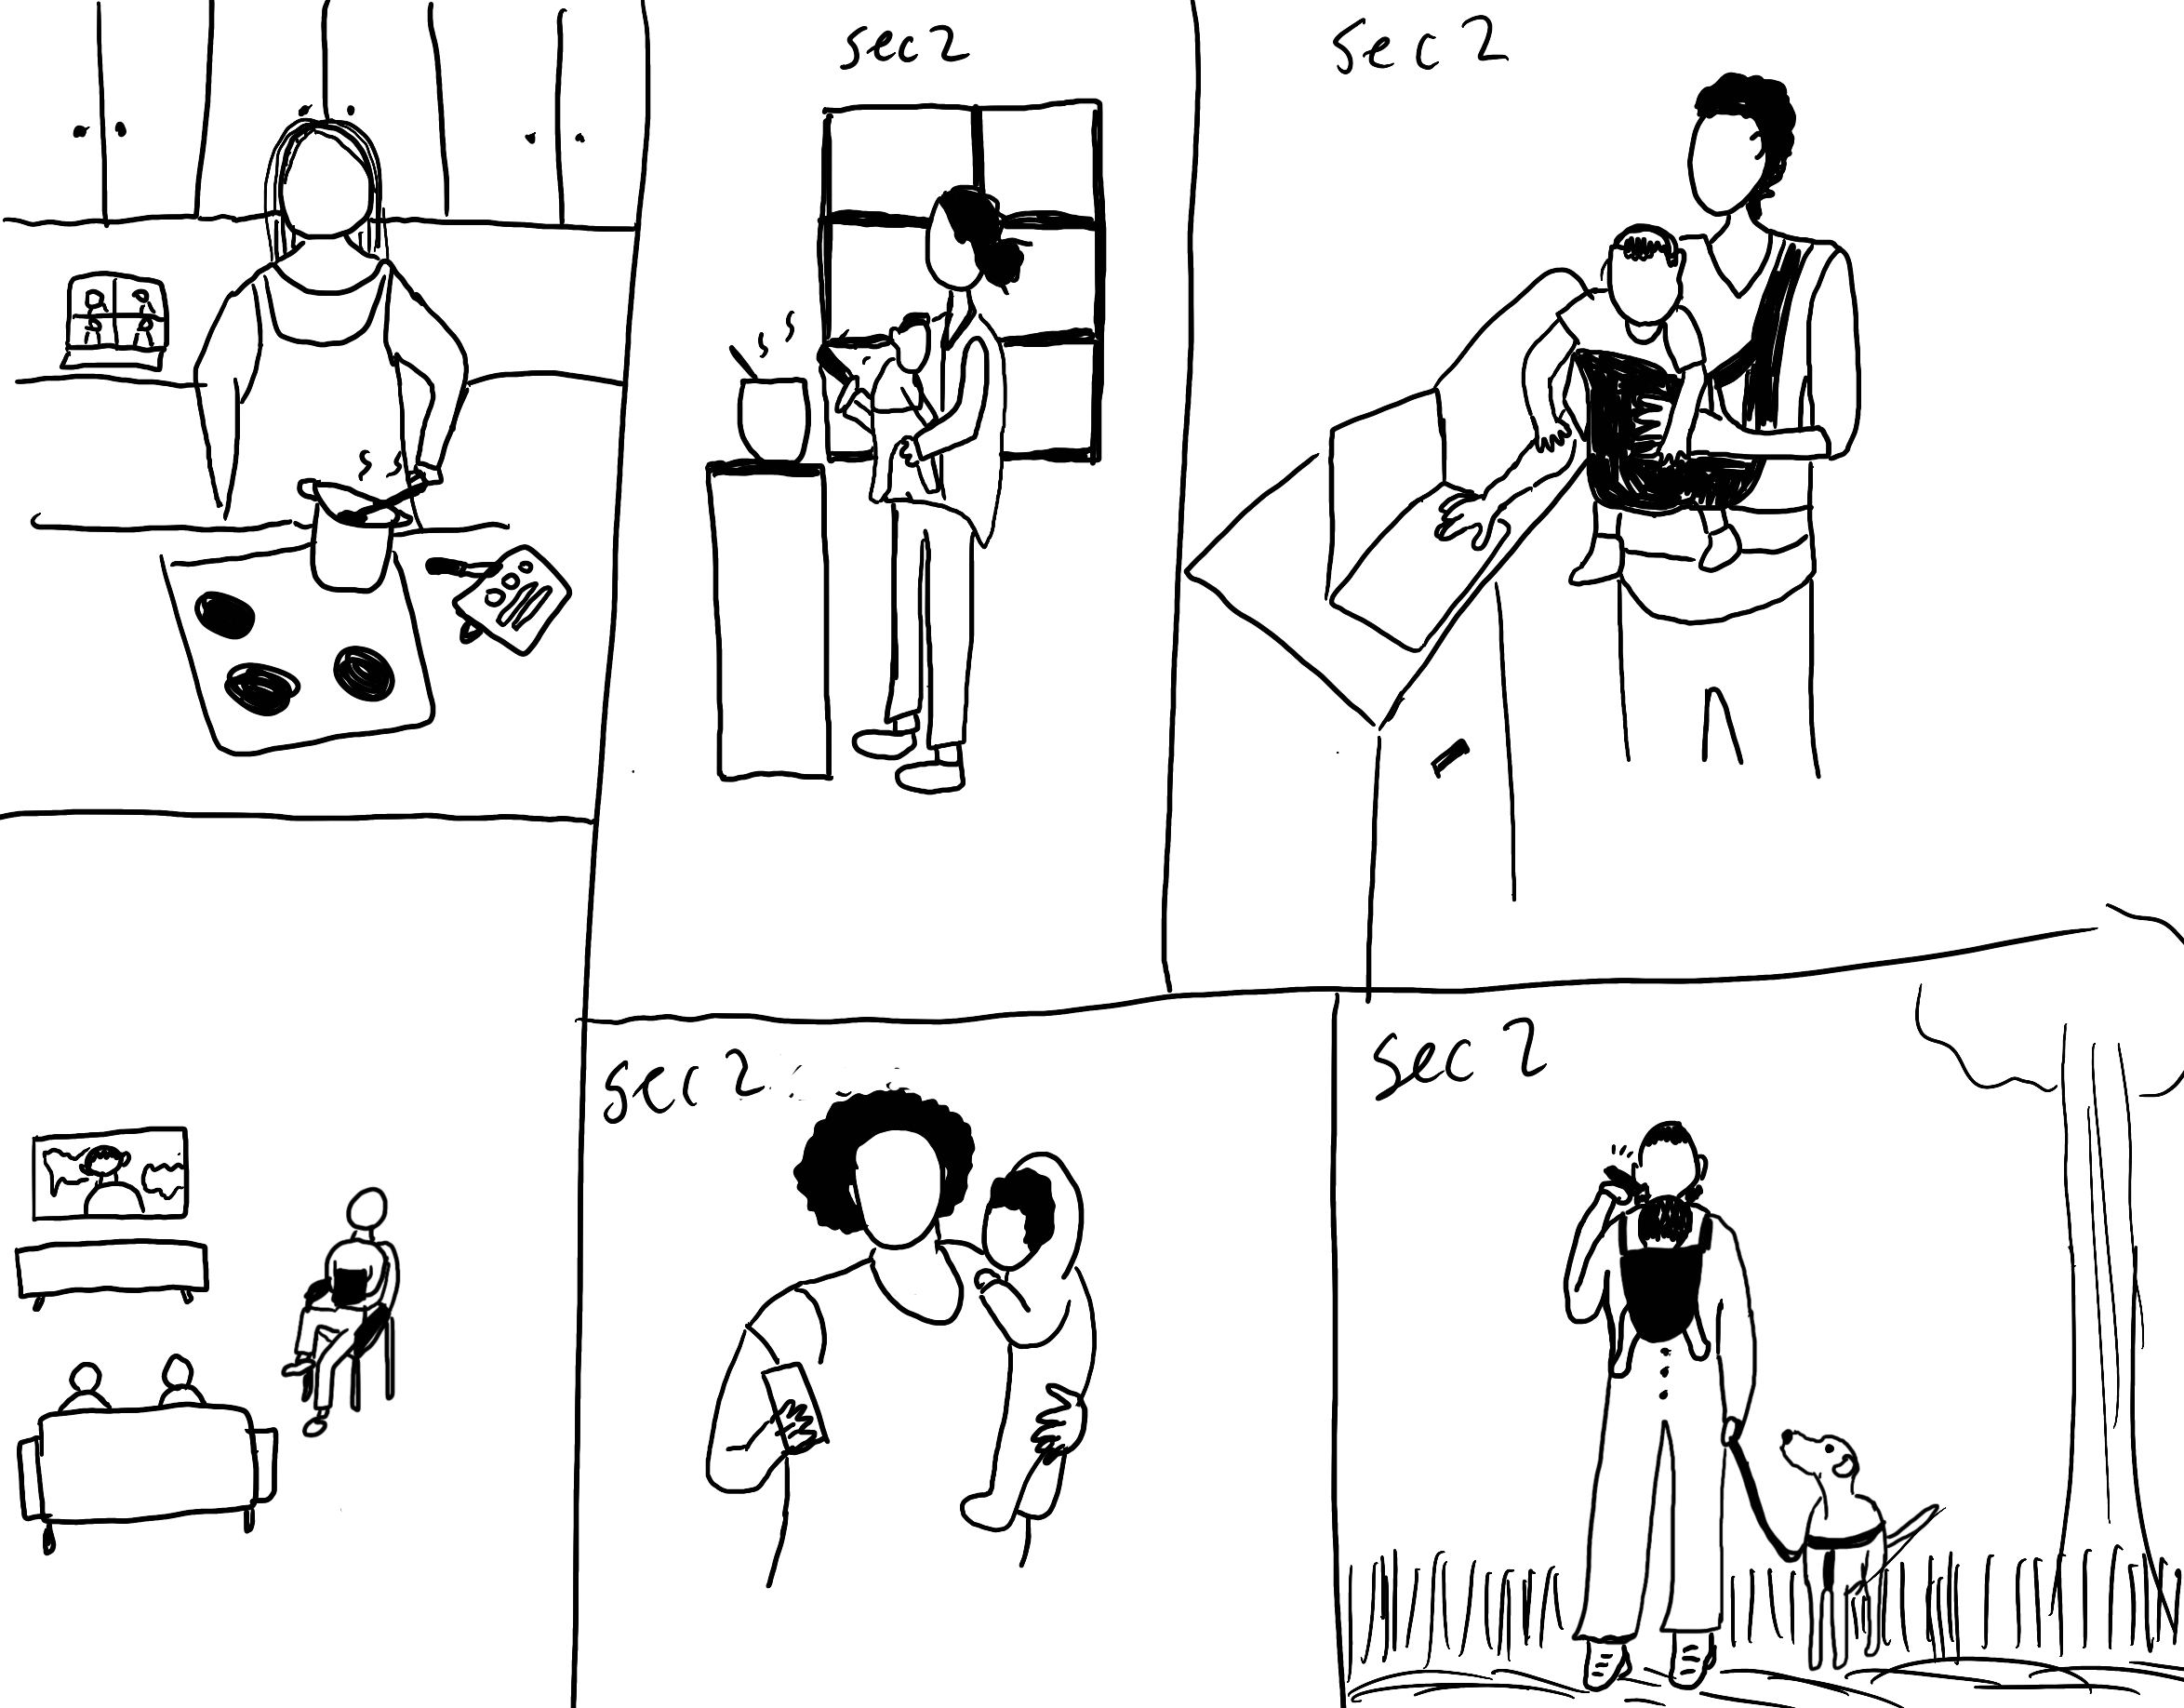
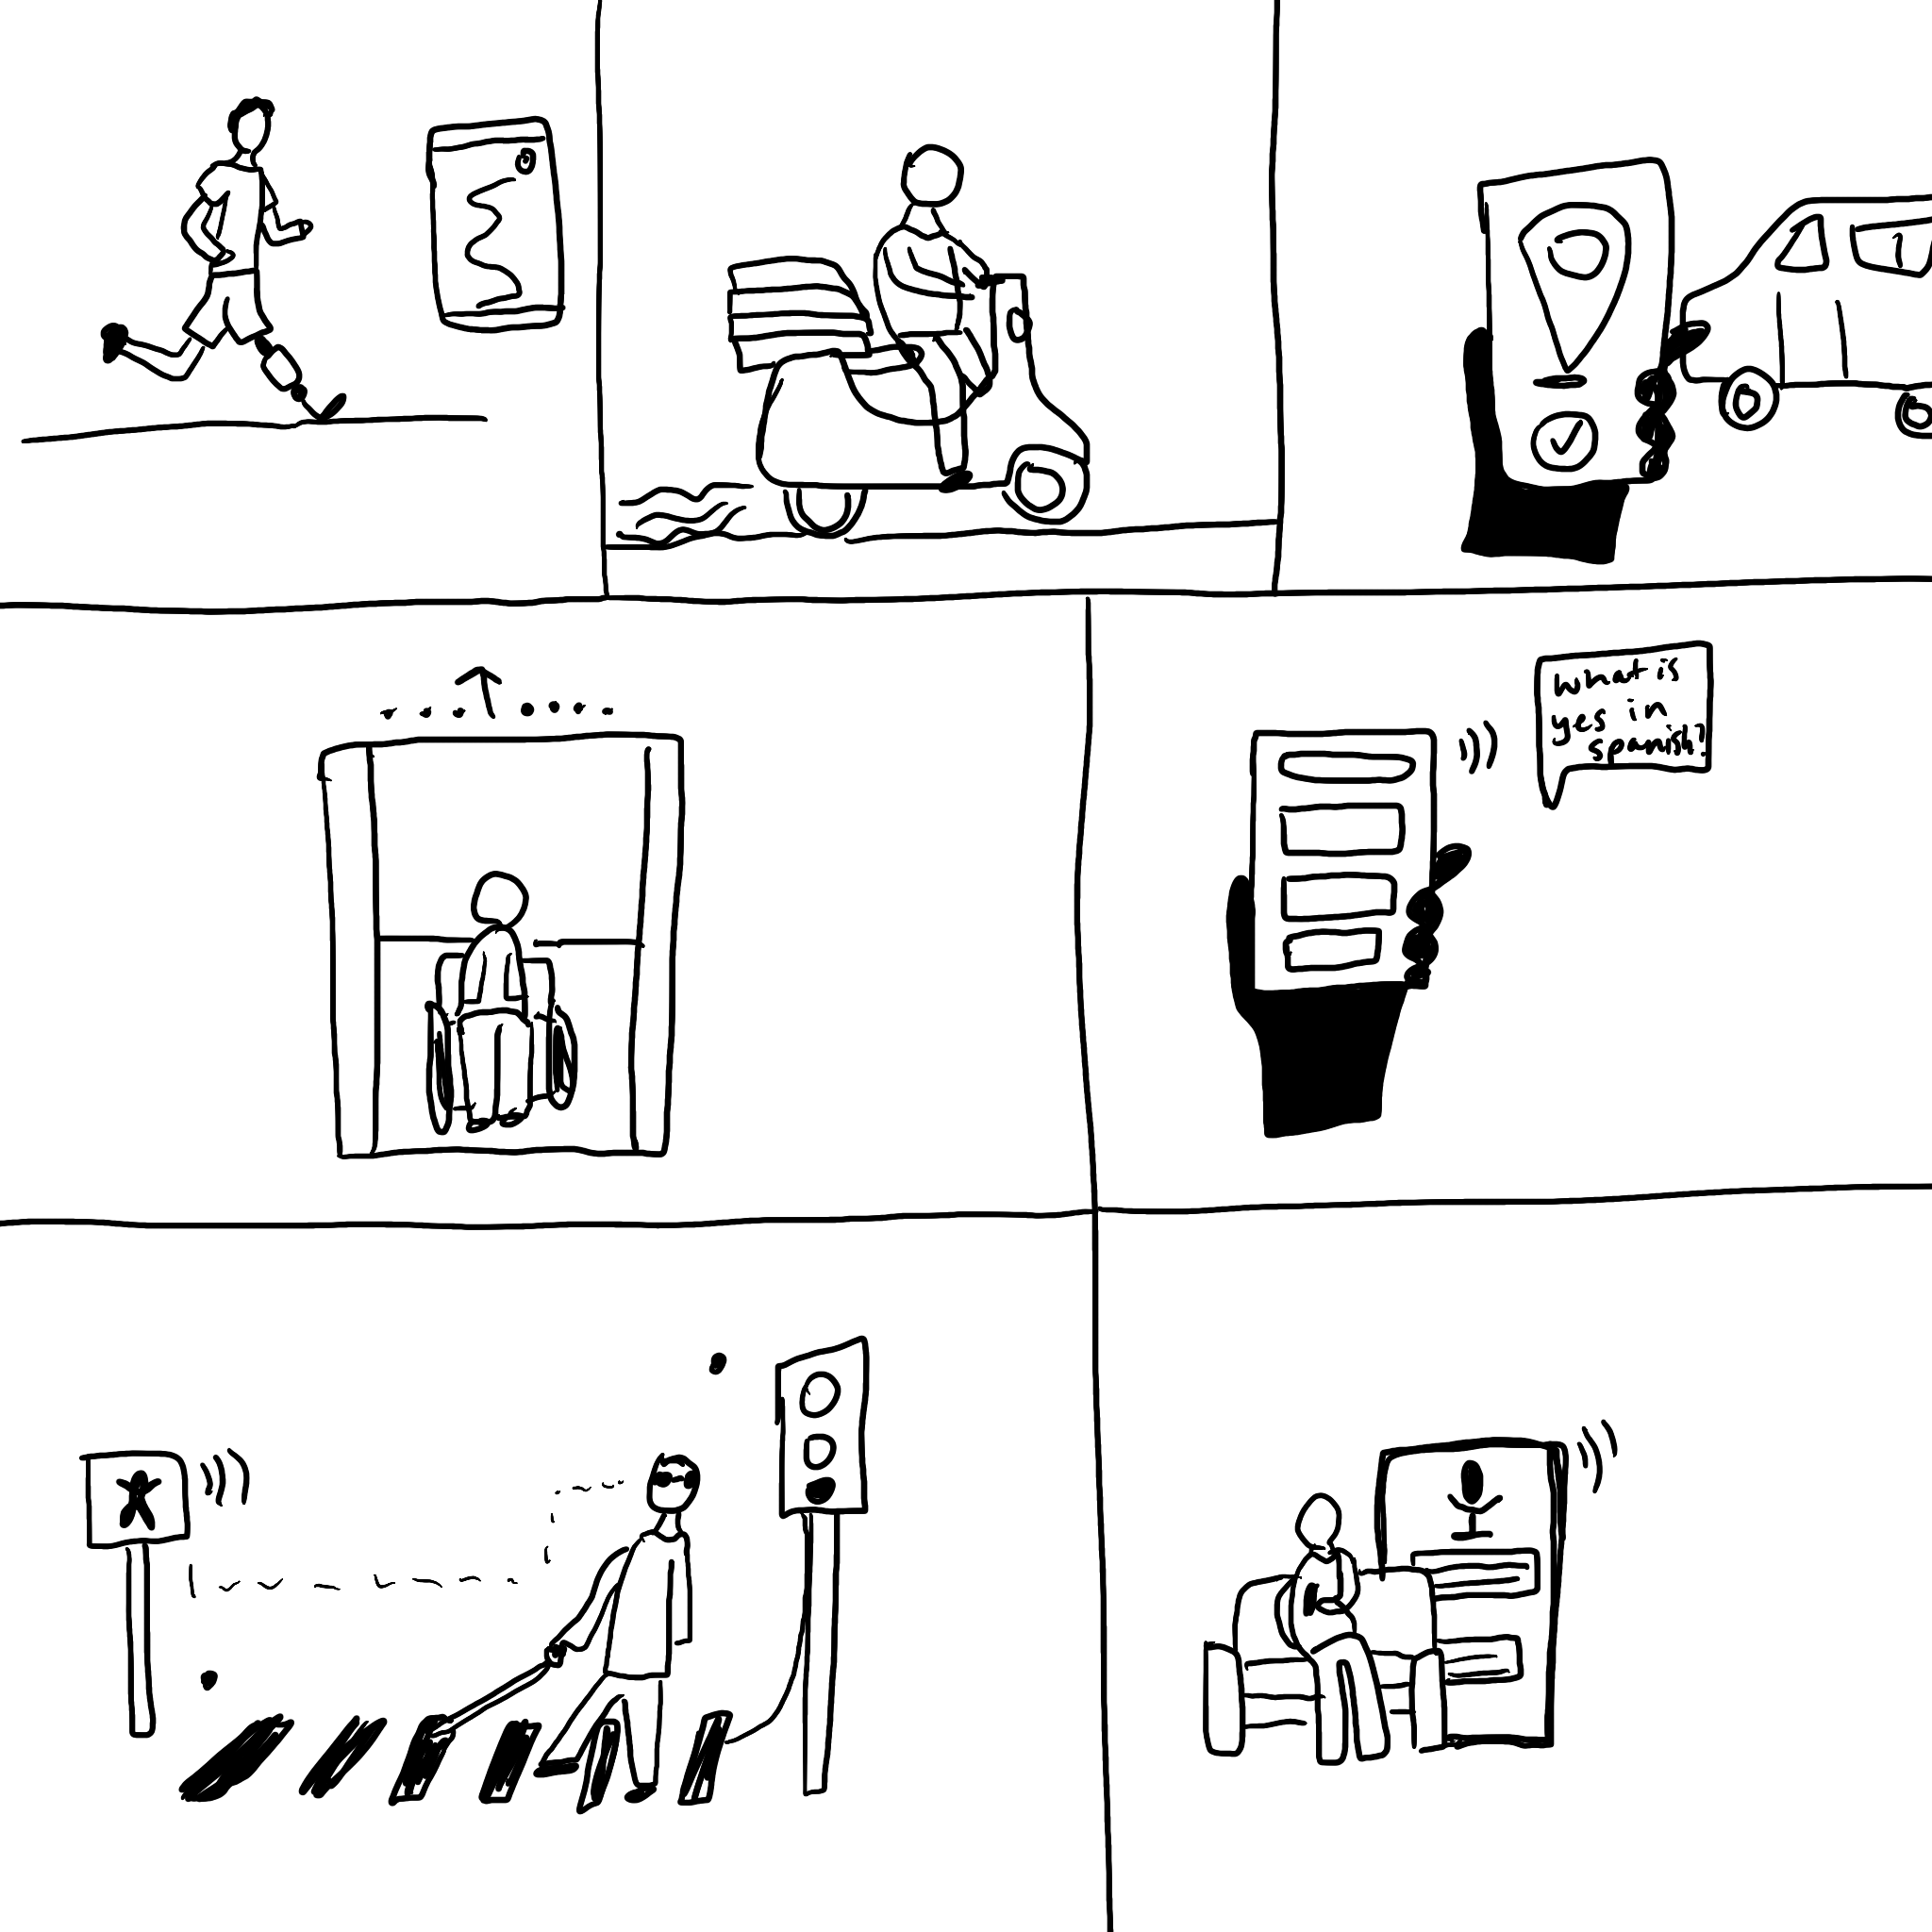
I start by looking at inspiration on Dribbble or Pinterest, then I use AI products to help with ideation and to understand the concepts. Once I have an idea, I start sketching in Procreate on my iPad. I then review my sketches with the team and eventually bring them into Illustrator.
Illustration Elements
I used a simplified palette featuring only one primary color and its various hues. Background elements were toned down to shades of grey, ensuring that the crucial elements took center stage.