Design & Illustration
SOAS-SectionHeros-MainHero-031022_km_Section 5.png

F5 State of Application Strategy Report Illustrations


State of Application Strategy Report 2024

Lead Illustrator

The State of Application Strategy Report (SOAS) is published annually. In this year's edition, we aimed to update the look and feel to align with the new creative framework, which includes black backgrounds, technical 2D illustrations, and bright colors. We decided to move away from human-first illustration and started using the technical vignette styling. Each illustration used a certain set of colors to differentiate each other but they all had the same styling.

I’ve also created illustrations for the SOAS reports in 20202022, and 2023.

Process
I start by looking at inspiration on Dribbble or Pinterest, then I use AI products to help with ideation and to understand the concepts. Once I have an idea, I start sketching in Procreate on my iPad. I then review my sketches with the team and eventually bring them into Illustrator.

Other materials created: web page graphics and an infographic


Sketches


Final Illustrations


SOAS Infographic

Instead of using a PDF, we opted for a web experience to create a more modern feel and track visitor data. Don Flora, our UX designer, brought my illustrations to life with small animations using Ceros, making the visuals more engaging than static images. We aimed for the infographic to feel like an interactive timeline that unfolds as you scroll down.

SOAS Web page

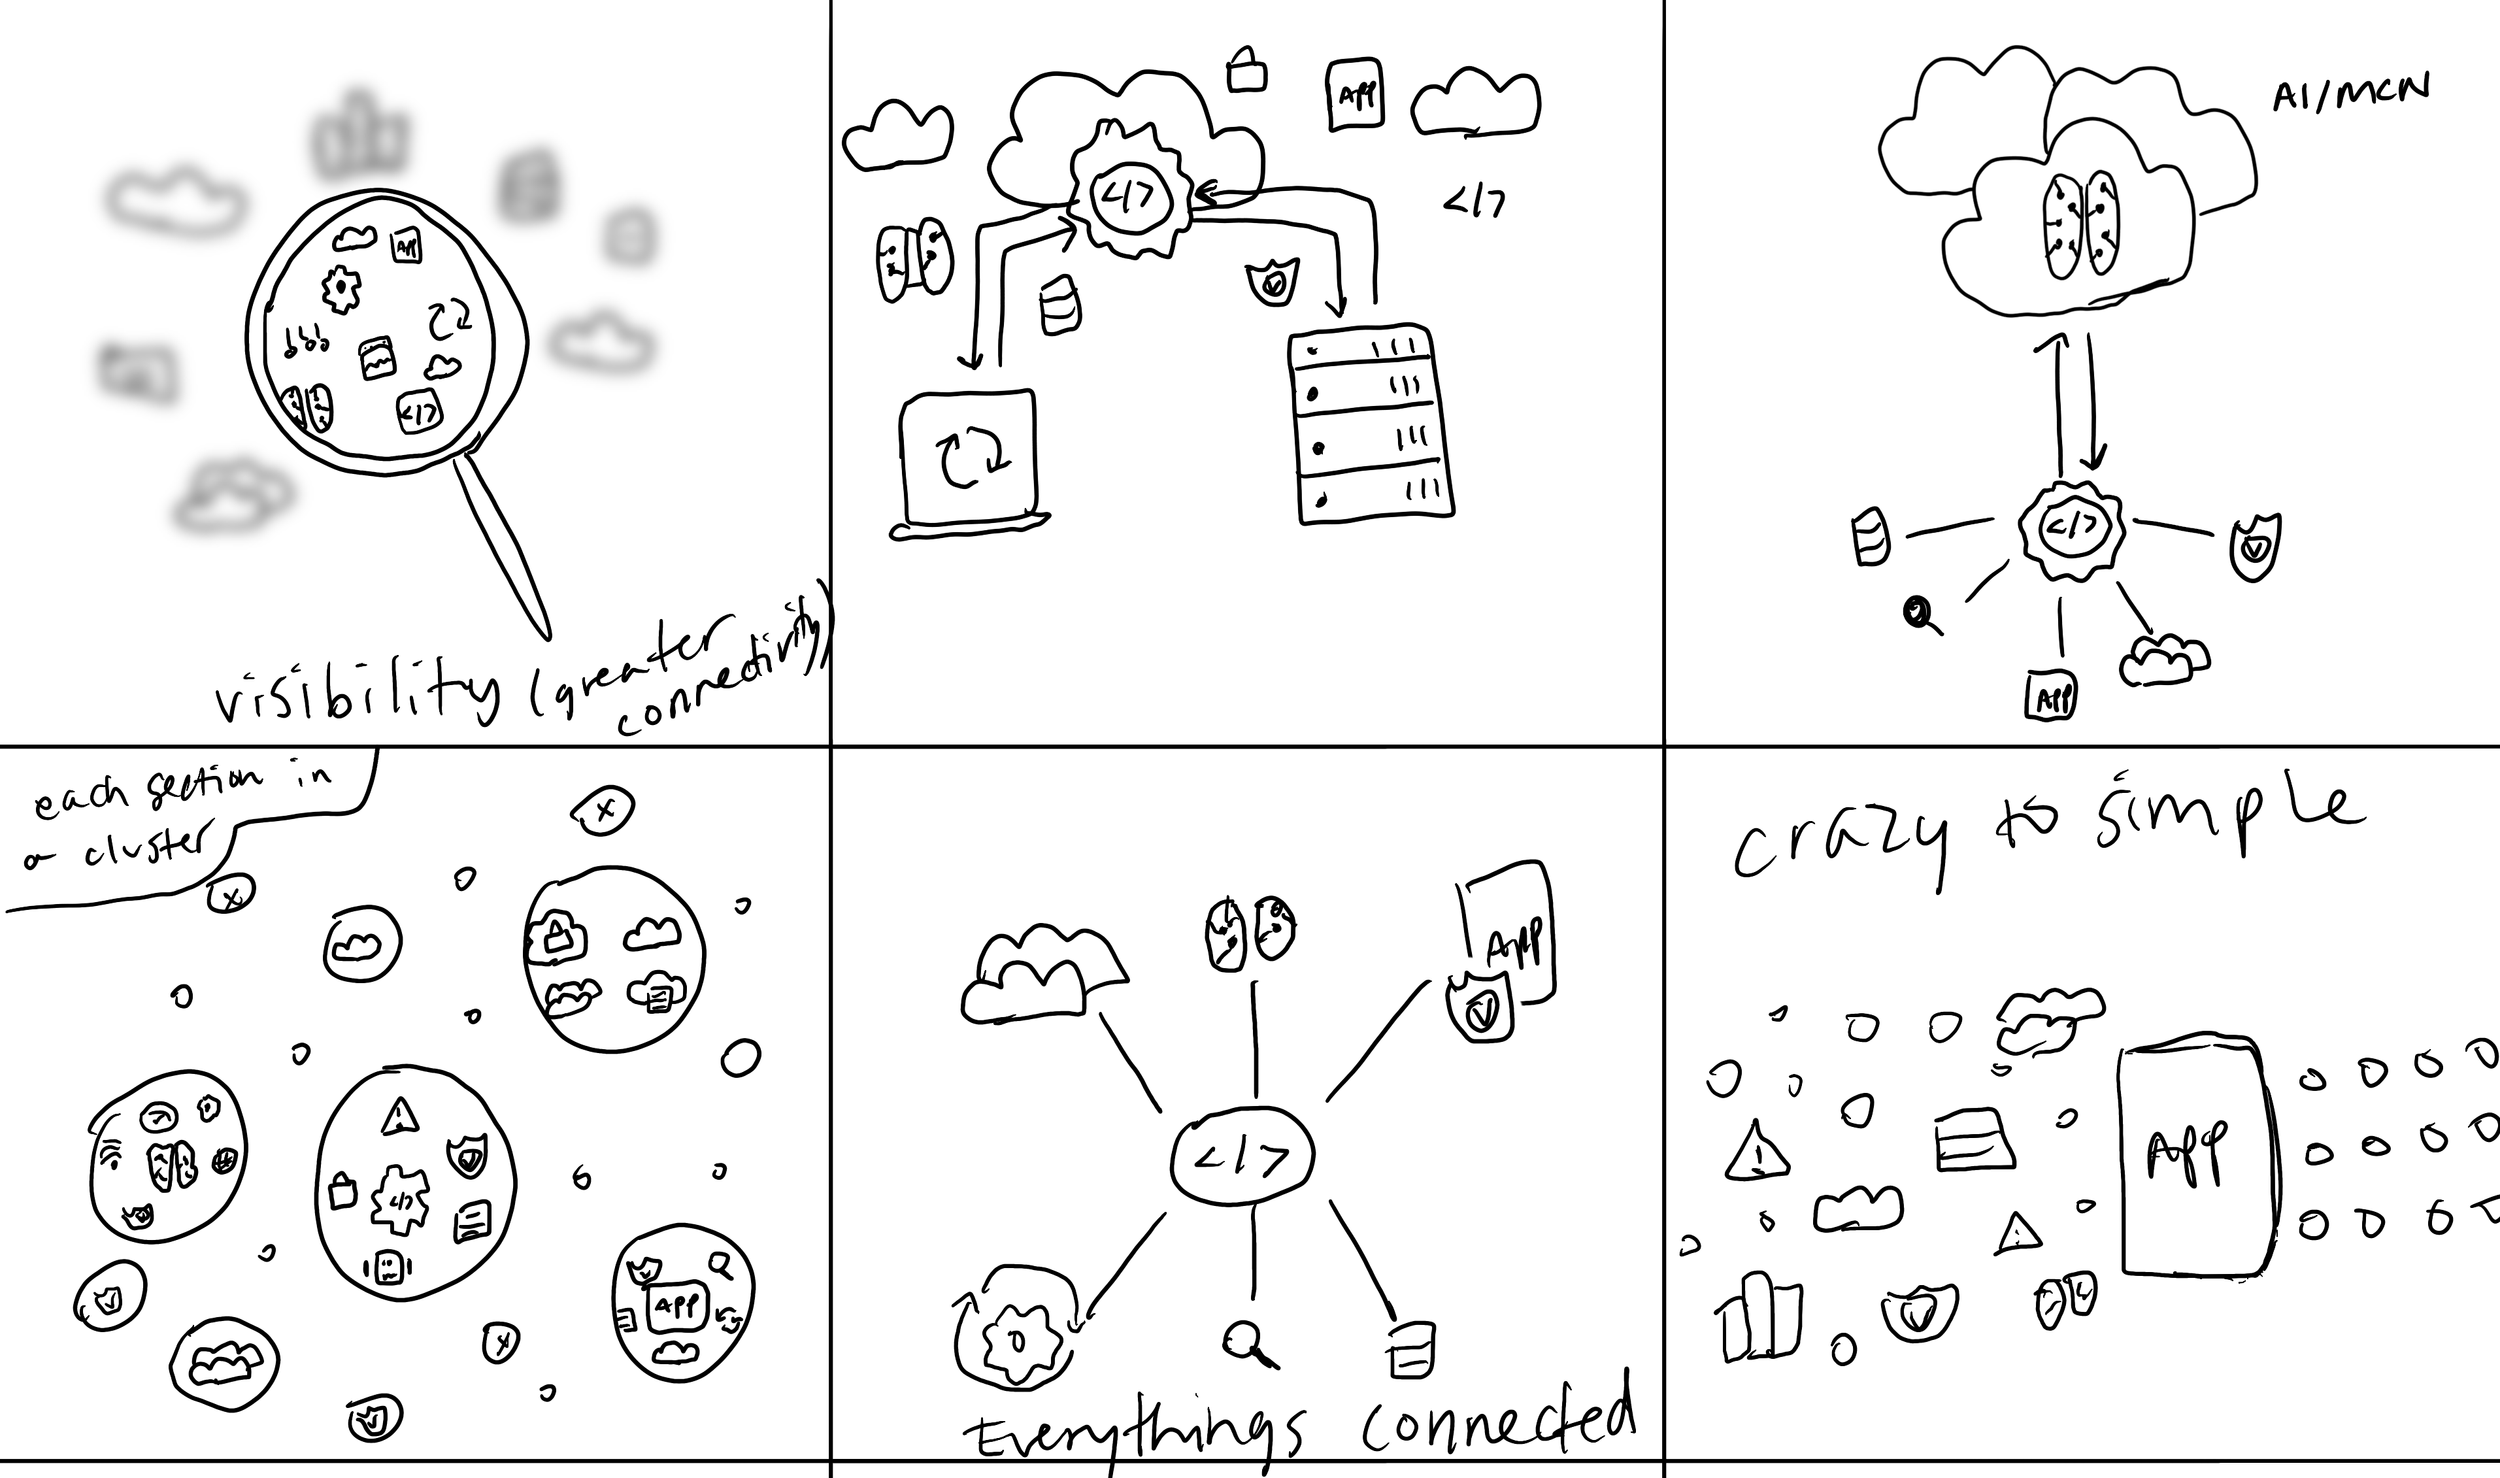
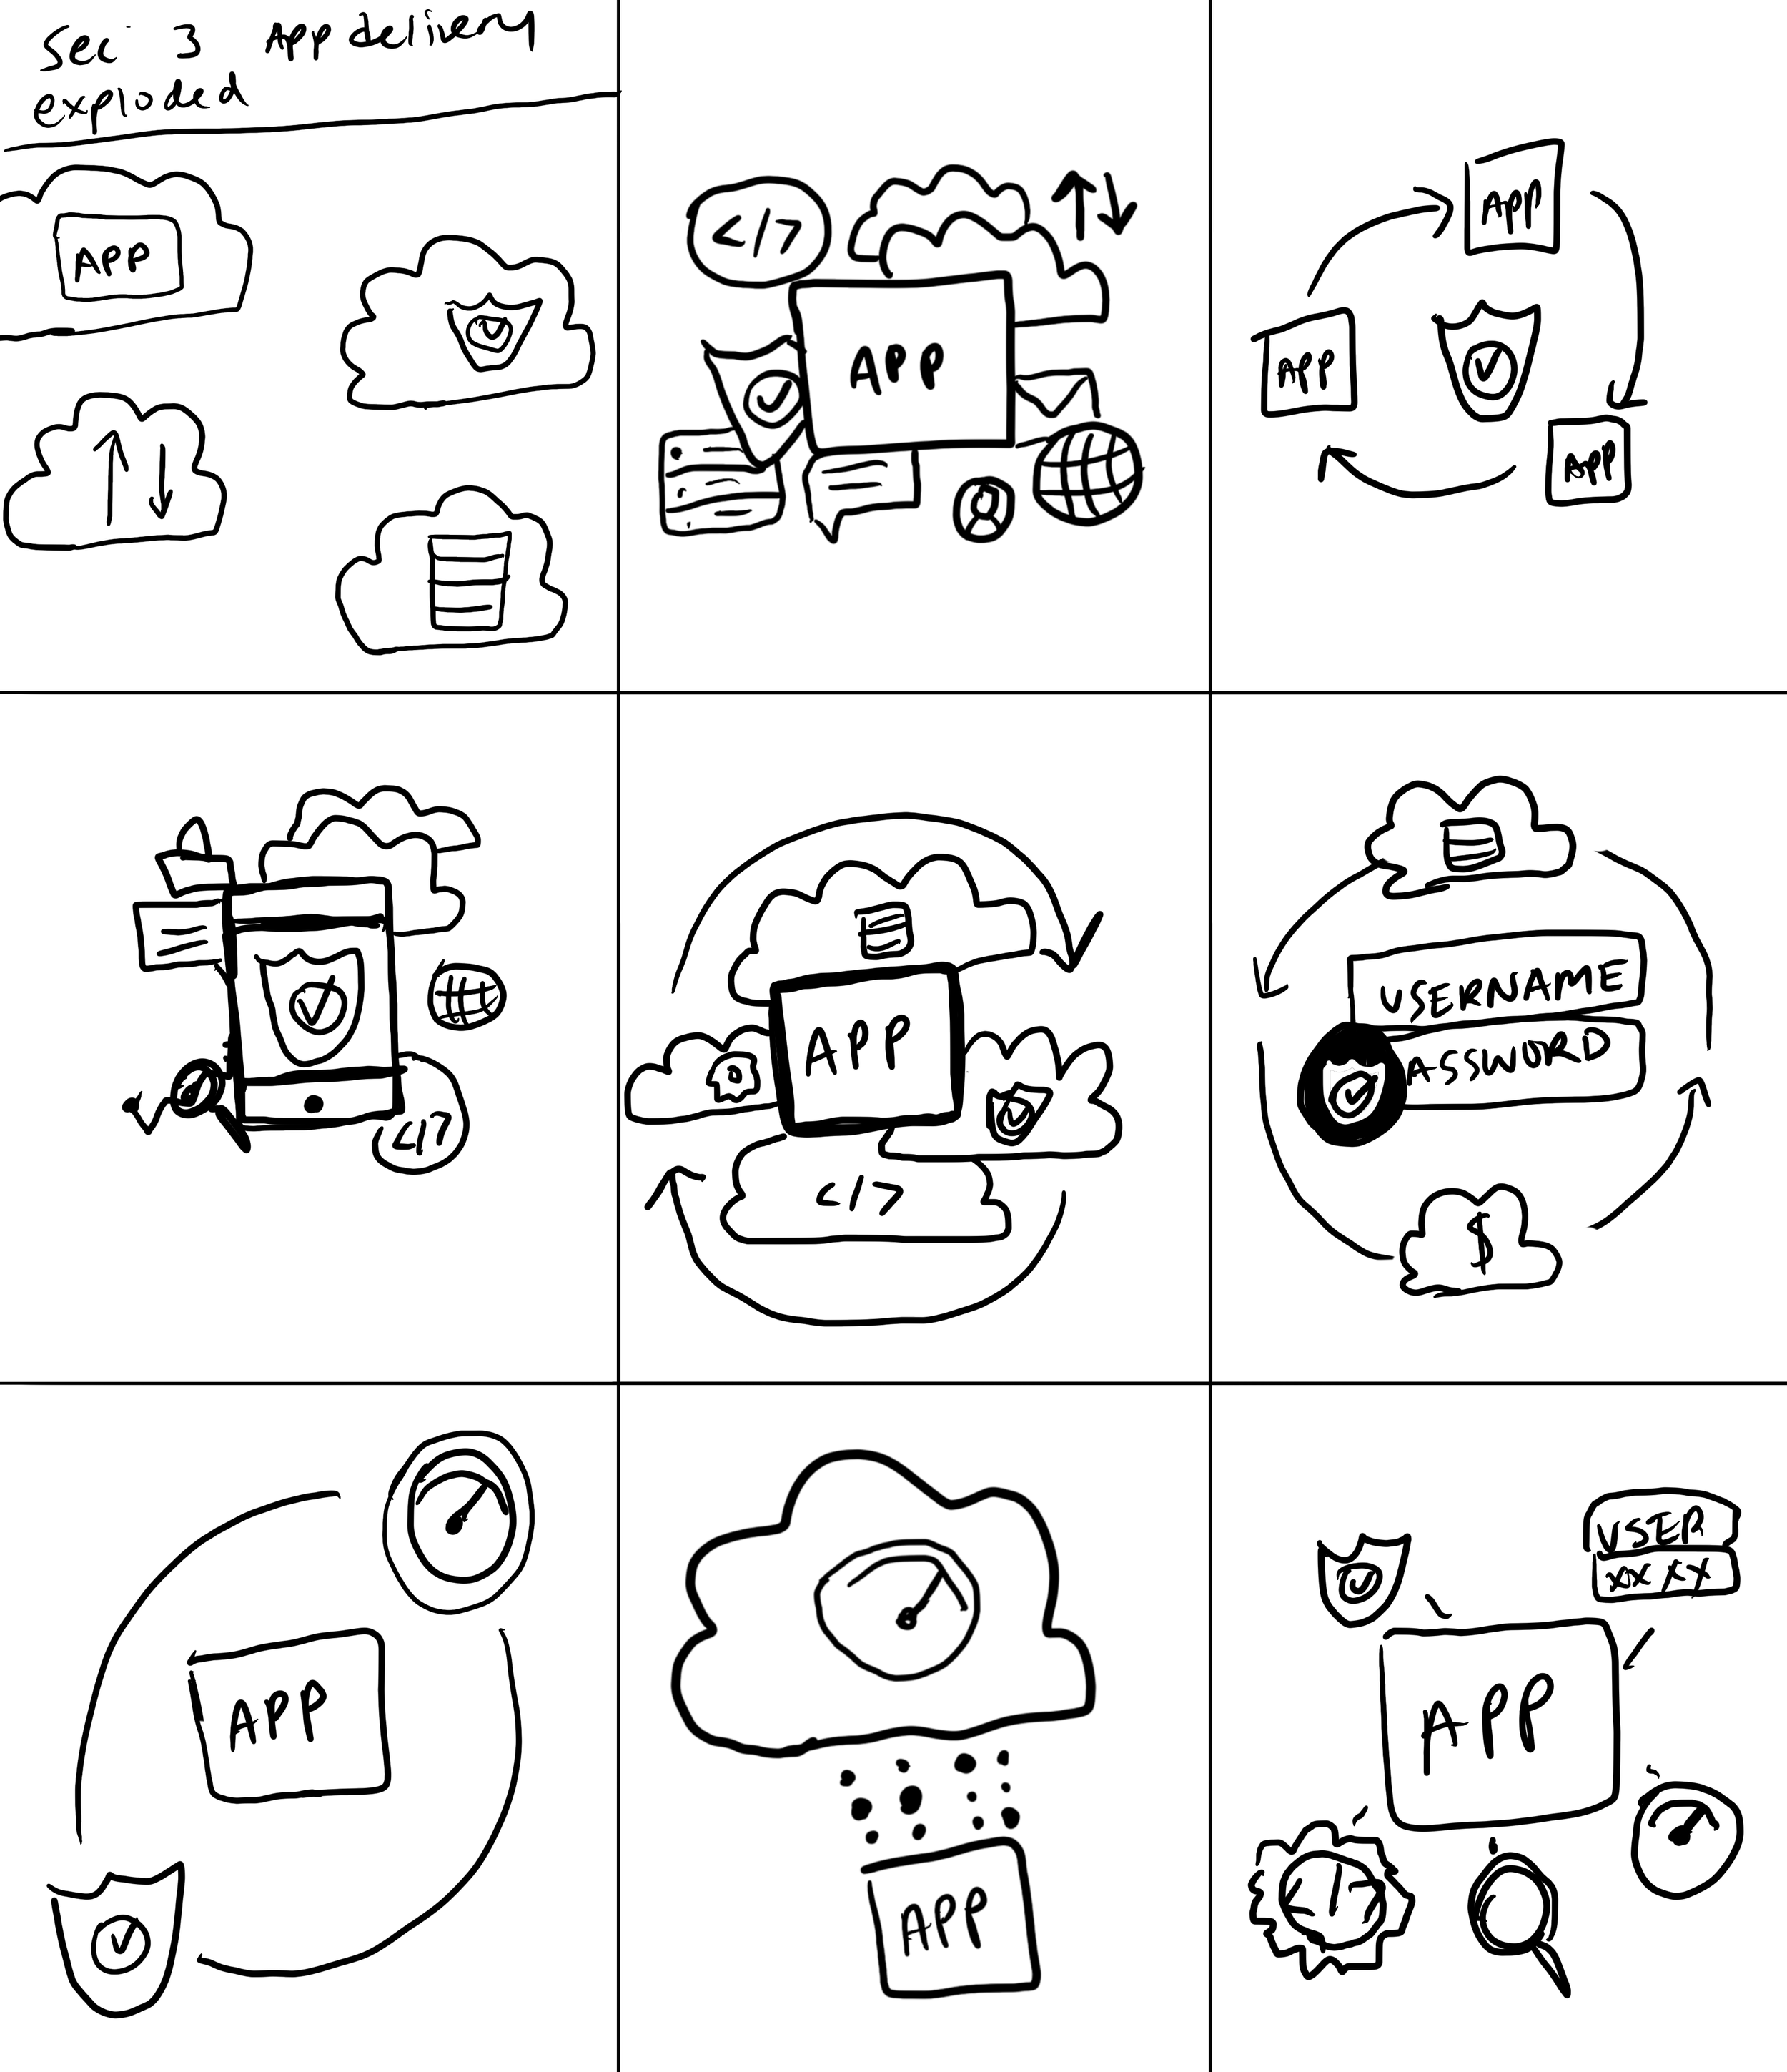
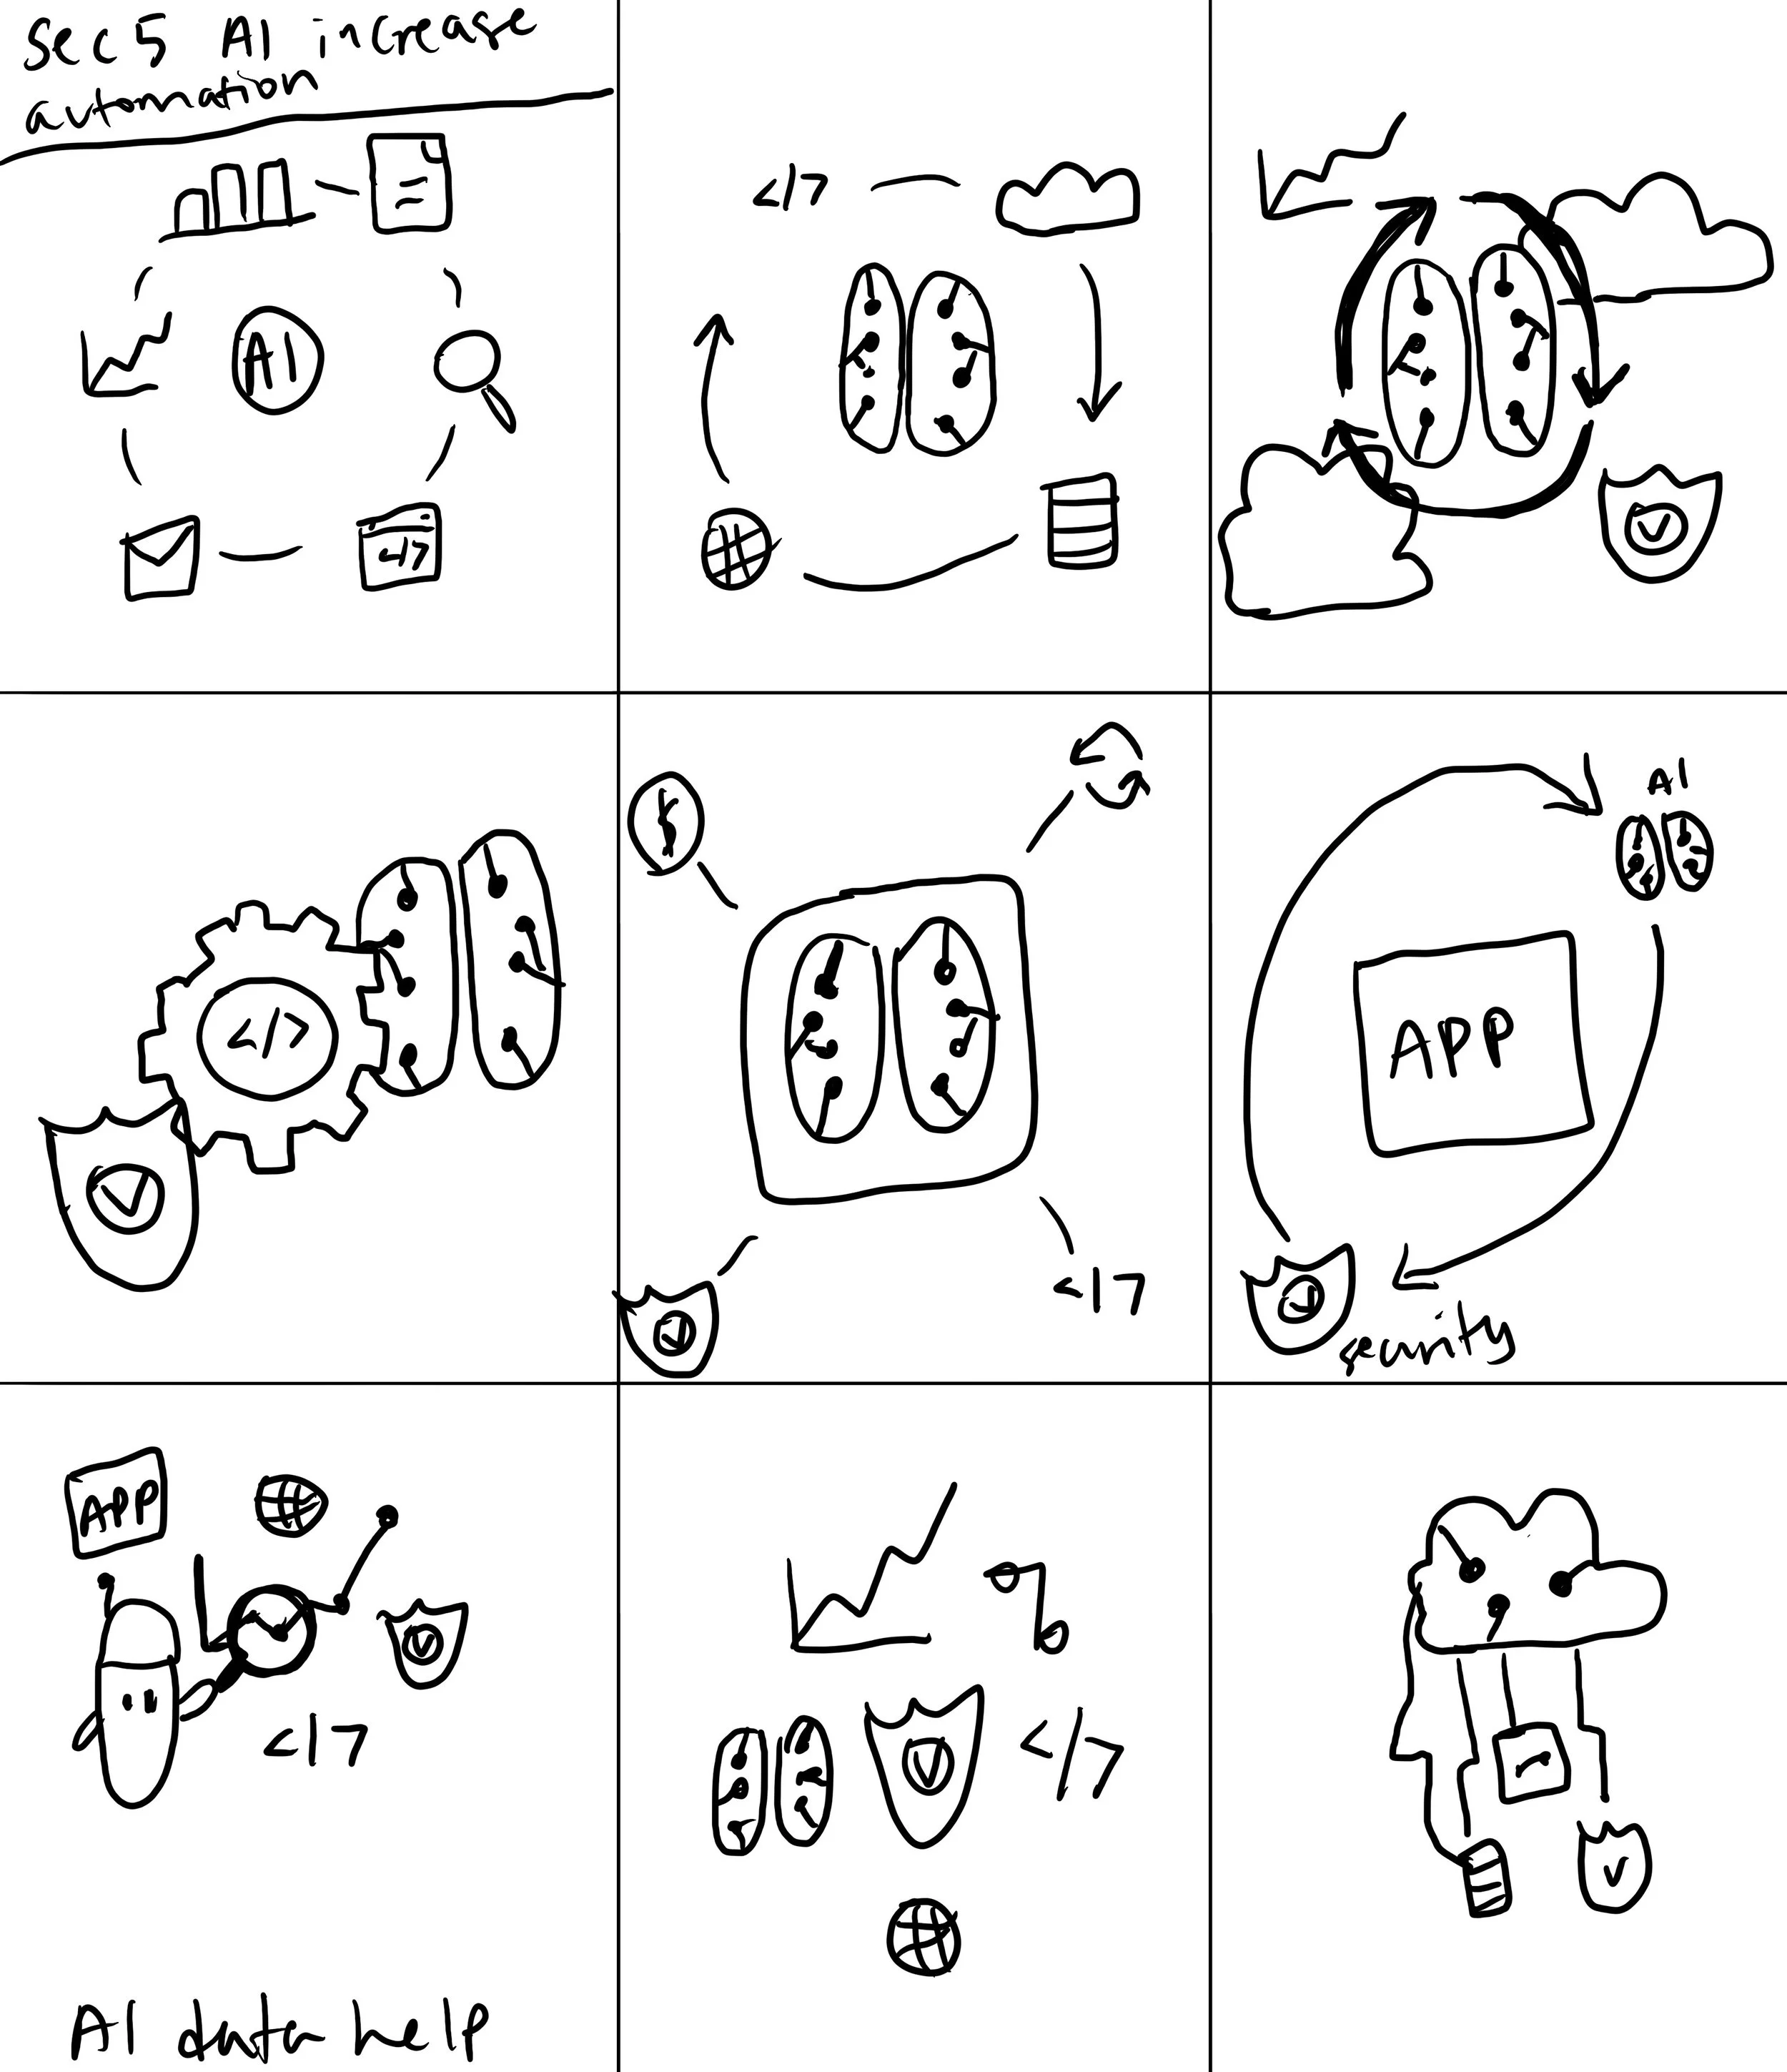
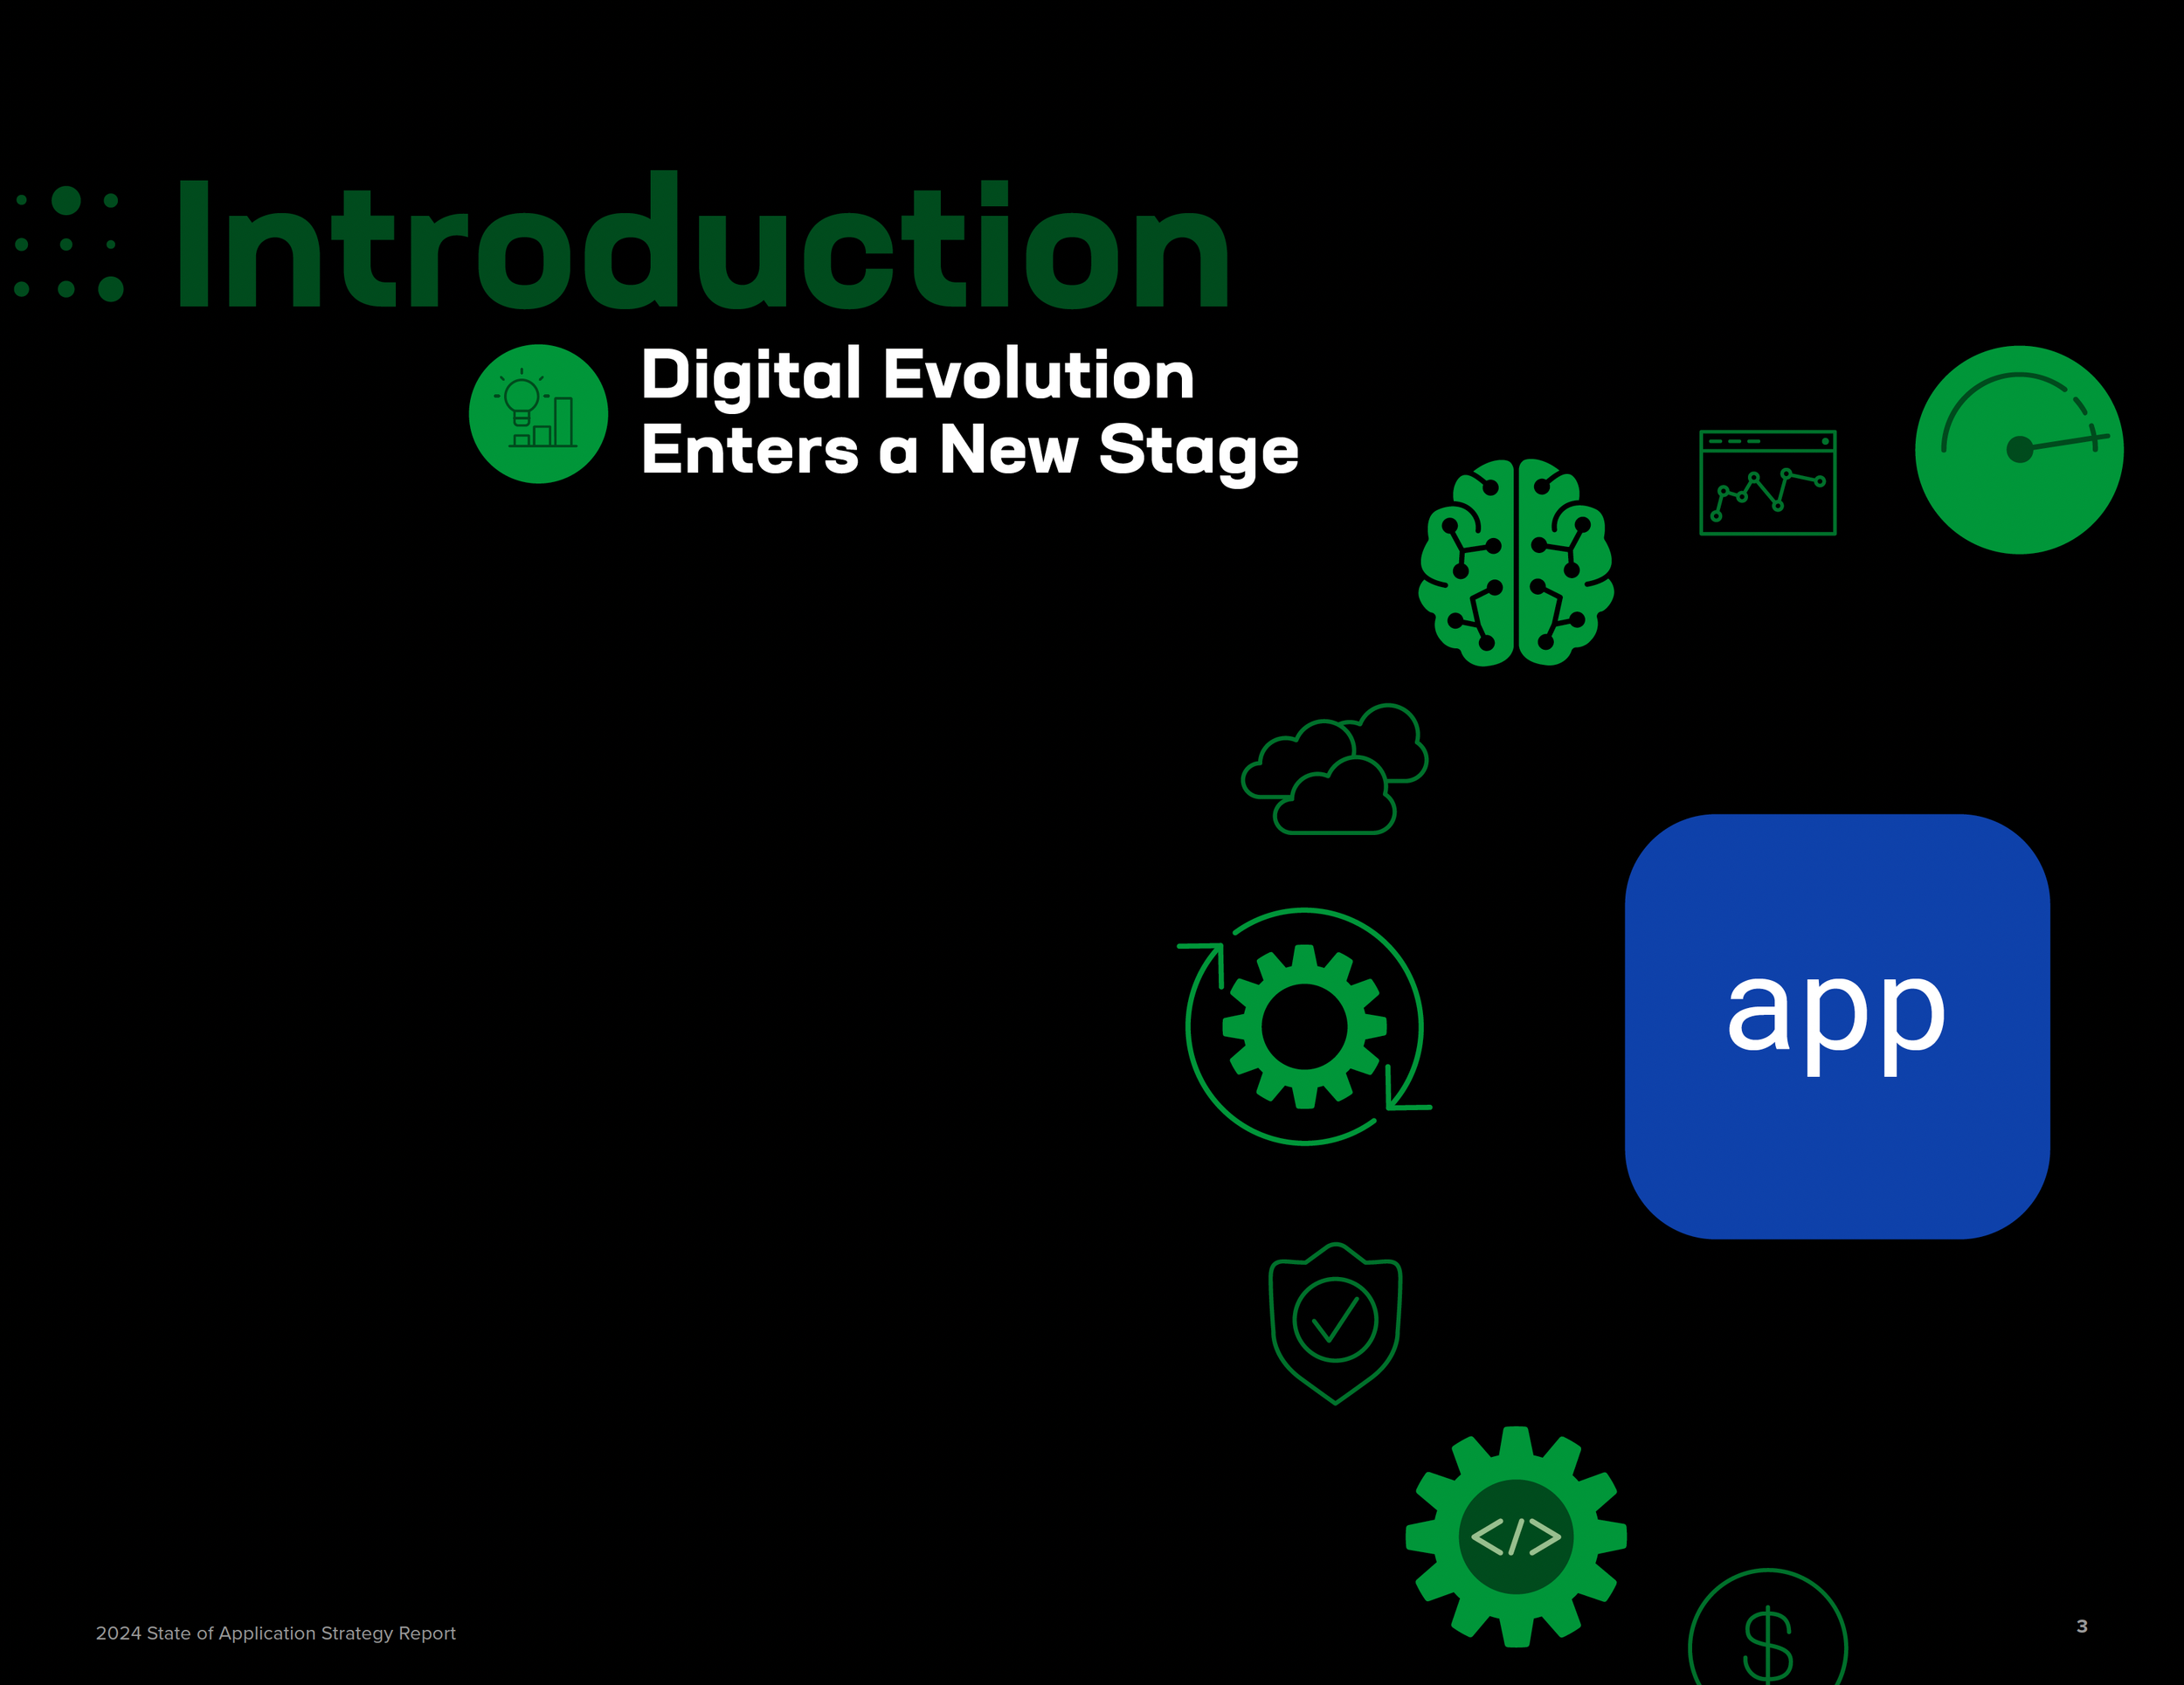
This year, we decided to incorporate a Ceros feature into the header image on the webpage. It's something we hadn't done before, as we typically keep the header image black due to the form being in the hero section. Our goal was to make the header more dynamic and engaging, encouraging more clicks.

I created the illustrations in the header Ceros feature, and the illustration in the survey divider.